
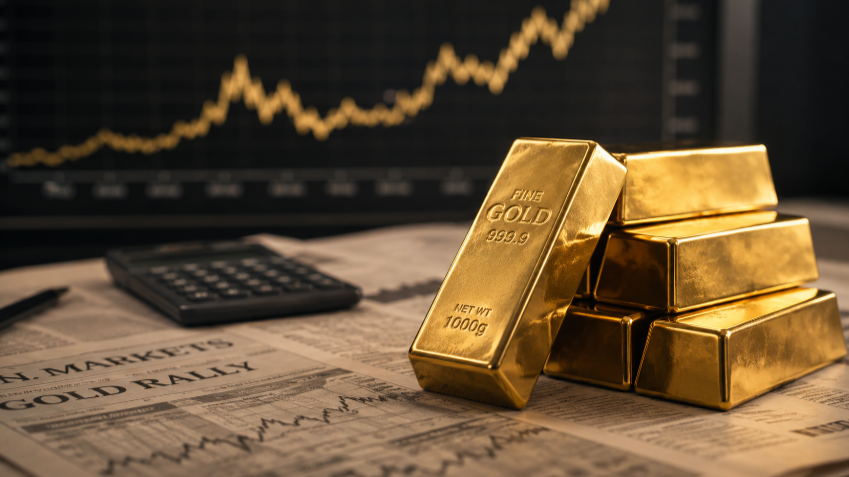
Gold has forced its way back onto portfolio screens after its second-quarter correction failed to end the broader investment case. Spot gold traded at about $4,611 an ounce on August 27, 2026, after reaching $4,696.18 two days earlier; the World Gold Council put the Q2 LBMA PM average at $4,506.29, still 37% above Q2 2025. More tellingly, gold-backed ETFs attracted 46.7 tonnes in one week in August, their largest weekly inflow in 10 months. The interest is returning even while government bonds still offer substantial yields.
The Longest-Horizon Buyers Never Really Left
Central banks bought a net 289 tonnes in Q2 2026, five times the revised Q1 figure of 57 tonnes and a record for any second quarter in World Gold Council data. First-half purchases reached 345 tonnes, although that remained the weakest H1 total since 2022 after the slow opening quarter. The Council’s June survey produced an equally clear signal: 89% of reserve managers expected global central-bank gold holdings to rise over the next 12 months, and a record 45% expected their own institutions to add reserves. The split is real.
Inflation Keeps the Fed in the Argument
The Federal Reserve’s preferred inflation gauge gives gold investors a stronger data point than July CPI. The PCE price index rose 3.7% year over year in July 2026, while core PCE increased 3.3%, both above the Fed’s 2% inflation objective. On July 29, the FOMC held the federal-funds target at 3.50%-3.75% by a 9-3 vote, with Beth Hammack, Neel Kashkari and Lorie Logan favoring a quarter-point increase. Gold therefore sits between persistent inflation, which supports demand for alternative stores of value, and restrictive rates, which raise the cost of holding an asset that produces no interest.
Bonds Are Still Offering Serious Competition
The U.S. Treasury’s official curve put the 10-year yield at 4.66% on August 26, so investors are not buying gold because bonds have stopped paying. Gold still pays no coupon. Instead, the August rally has coincided with renewed concern over U.S. fiscal deficits, currency purchasing power and intervention in the long end of the Treasury market; expanded government bond buybacks initially pushed the dollar lower and helped revive the so-called debasement trade. Gold increasingly occupies a different portfolio slot from Treasuries: protection against monetary, geopolitical and fiscal risks rather than a direct substitute for fixed income.
A Risk Story Still Needs Position Sizing
Gold can help diversify a portfolio, but bullion, ETFs and mining shares can behave very differently during a downturn. None offers guaranteed protection over a short period. That makes position size more important than any persuasive macro story, particularly with mining shares, which add operating costs, political and regulatory risks, and production problems to movements in the gold price.
The same idea applies to entertainment spending. Someone using casino Tunisie can set aside a fixed bankroll, check the RTP and house edge, and play slots or roulette without confusing short-term luck with an investment return. A single-zero European roulette wheel has a house edge of about 2.7%. A slot’s RTP is a long-run theoretical average, not a prediction of what will happen during one evening.
ETF Flows Just Reversed Direction Again
Gold-backed ETFs show how quickly institutional positioning can move. Global funds lost about 45 tonnes in Q2, reducing first-half net ETF demand to only 18 tonnes, while U.S.-listed funds recorded 61 tonnes of H1 outflows; World Gold Council data shows that American selling was heavily concentrated in March and June rather than spread evenly across six months. Then the tape changed: the week reported on August 24 brought 46.7 tonnes of ETF inflows, led by North American and European funds, as gold moved back above its 200-day moving average. That reversal helps explain why a relatively modest change in rate or dollar expectations can produce a fast price response.
Miners Turn a High Gold Price Into an Operating Test
Mining equities provide more leverage to gold prices, but the operating numbers decide whether that leverage reaches shareholders. Agnico Eagle reported a $4,483 realized gold price in Q2 against all-in sustaining costs of $1,459 per ounce, generating a record $1.335 billion of quarterly free cash flow and returning $625 million through dividends and share repurchases. Newmont realized $4,414 per ounce, reported AISC of $1,621, and generated $2.2 billion in free cash flow during the same quarter. With bullion above $4,000, investors can now separate miners that merely benefit from a high commodity price from those controlling costs, meeting production guidance, and converting the margin into cash.

Guest Account for Paid And Sponsored Content on Raptology.com. Posts by Guest Authors are independent of our regular editorial content.



















Leave a Reply